
Ah, 2010. Does it feel like yesterday… or a lifetime ago?
We were two years into a recession. The iPhone was a new invention. The BP Deepwater Horizon Oil Spill, the earthquake in Haiti, the passing of the Affordable Care Act: all on people’s minds. Remember the vuvuzelas at the FIFA World Cup in South Africa? It was simpler time. Maybe.
It was also the year The MPI Group started tracking data on the green practices of manufacturing plants around the world. Ten years later, in 2020, we conducted our most recent MPI Manufacturing Study. Looking at the data over the years, interesting trends emerge.
Renewable Energy
In 2010, 15% of manufacturers reported using renewable energies. By 2020, 43% were using renewable energies. With the changing cost to produce electricity from renewables vs. fossil fuel sources, it’s no wonder more manufacturers have access to renewable power than 10 years ago.
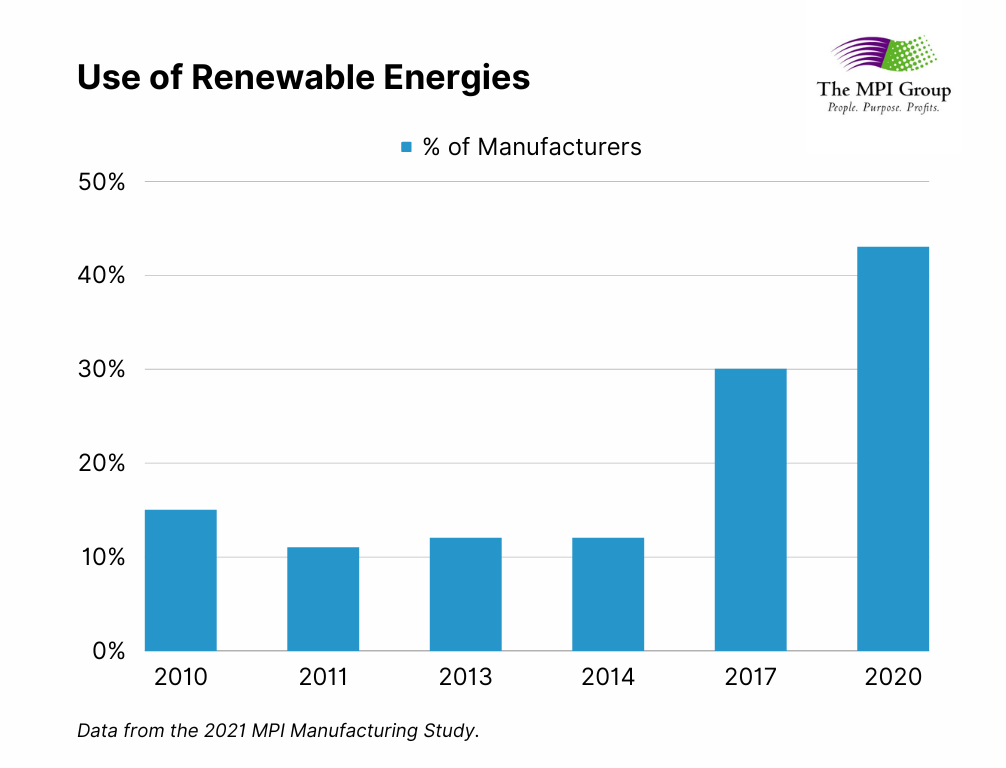
In 2009, the price of electricity from photovoltaic solar was $359/MWh compared to electricity from nuclear ($123), coal ($111), and natural gas ($83). In 2019, solar was $40/MWh compared to nuclear ($155), coal ($109), and natural gas ($56).[1][2]
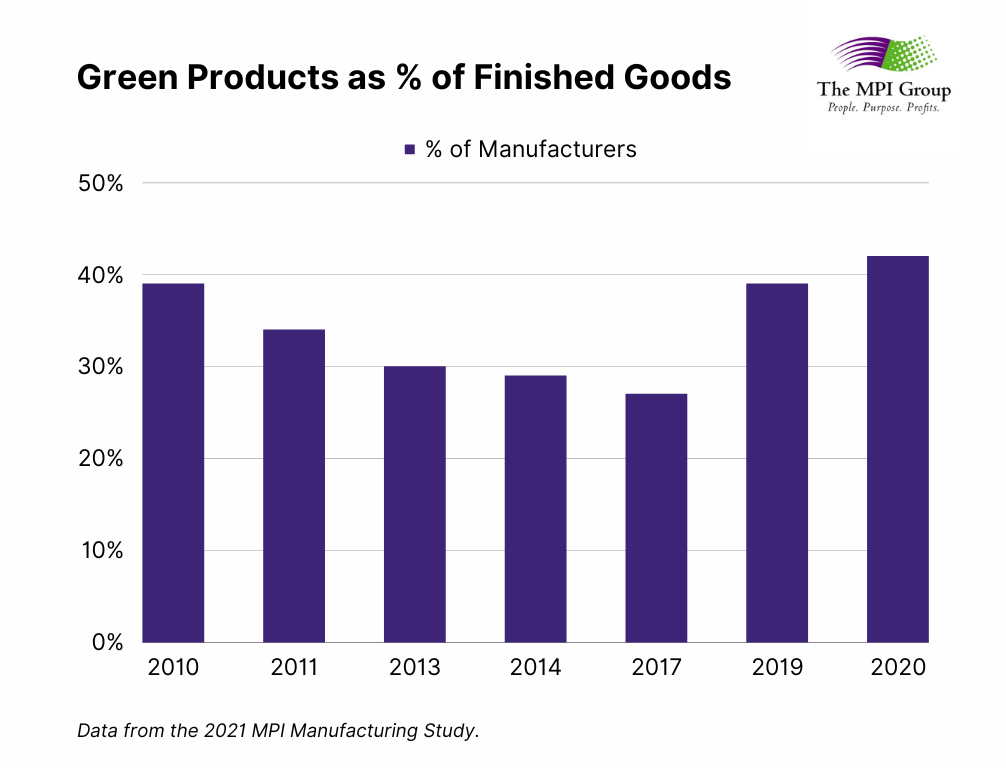
Green Products
There are several ways to define what makes a product “green,” but for MPI’s purposes, green products are finished goods that can be reused or recycled.
Green products as a percentage of finished goods declined from 2010 to 2017, only to see a significant rebound in 2019. Overall, there was a modest increase in the average percentage of green products over the last 10 years, from 39% to 43%.
With the increased interest in the concept of a circular economy, manufacturers are thinking differently about what it means for a product to be “recyclable.” Companies are not only asking how they can make their products easy to dispose of in less harmful ways, but also how they can reuse the materials from end-of-lifecycle products to save money on procurement.
Product Carbon Footprints
A product carbon footprint (PCF) is a single measurement of the total carbon emissions produced over the life cycle of a product. A PCF includes emissions from the procurement of raw materials, the manufacturing process, use and disposal of the product, and the transportation required to move the product from point A to point B throughout its lifespan.
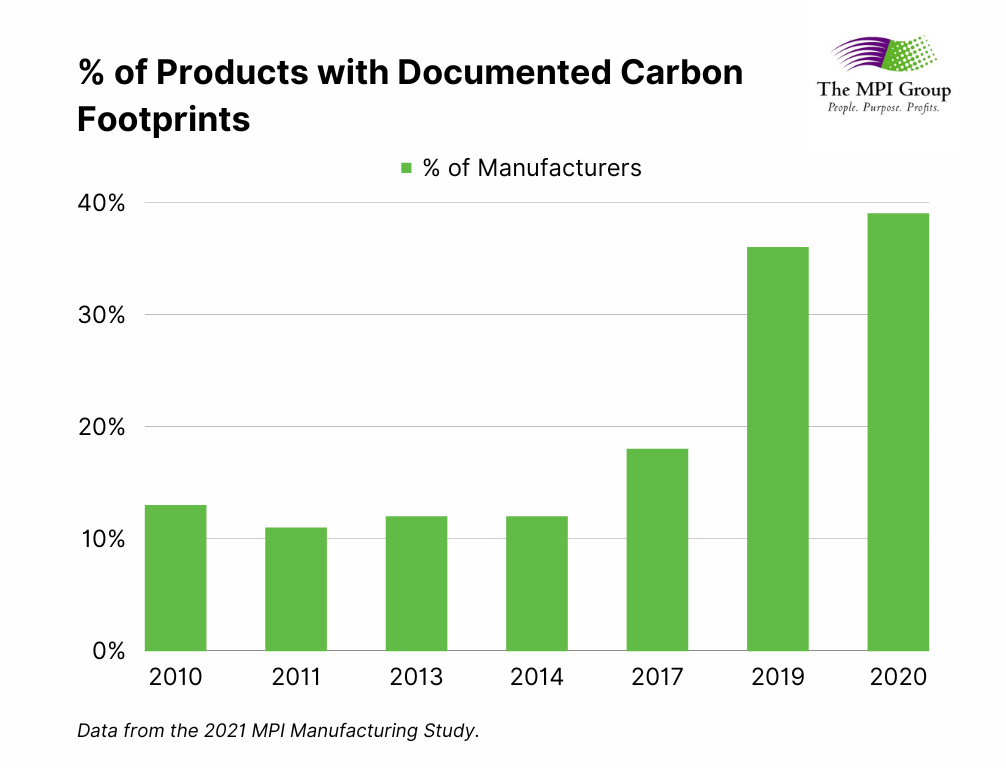
In just two years, from 2017 to 2019, MPI saw a large jump in the average percentage of products with carbon footprints, from 18% to 36%.
The increase in using PCFs comes as companies strive to meet ambitious environmental, social, and governance (ESG) goals. PCFs allow companies to expand their understanding of the environmental cost of their products. It’s not enough to measure emissions of in-house operations: a majority of a product’s environmental impact can come from the rest of the value chain, from suppliers to customers. With a PCF in hand, manufacturers can make an ESG impact across the value chain.
A lot has changed in 10 years. Over the last decade, MPI has seen an exciting rebound in green manufacturing practices after years of stagnant growth, and, in 2023, we’ll be bringing you brand new green manufacturing data. Interested in contributing a new question or green practice to the study? Reach our research team here.
[1] Roser, Max. (2020) “Why did renewables become so cheap so fast?” https://ourworldindata.org/cheap-renewables-growth
[2] Prices expressed in ‘levelized costs of energy’ (LCOE). LCOE captures the minimum price someone building a new power plant would have to charge customers over the life of the plant to break even.